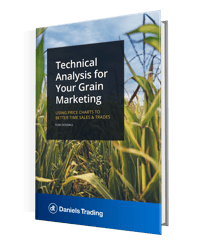
Commodities can fluctuate in price sharply and quickly. Producers often wish they had greater insight into the price changes, but are uncertain how to use technical analysis to their advantage. We can help.

What does this all mean? After reading the guide, you’ll have a better handle on when to sell physical bushels, when to “hedge” your downside risk, and when to re-own bushels with either futures or options after making a physical sale.
Download your free copy of this guide today to get started.
“Lorem gravida nibh velit auctor aliquet. Aenean sollicitudin, lorem quis bibendum auctor, nisi elit consequat ipsum, nec sagittis vulputate cursus a sit amet.”
Lorem Ipsum - Title and Company
“Duis aute irure dolor in reprehenderit in voluptate velit esse cillum dolore eu fugiat nulla pariatur. Excepteur sint occaecat cupidatat non proident, sunt in culpa qui officia deserunt mollit anim id est laborum. Sed ut perspiciatis unde omnis iste natus error sit voluptatem accusantium doloremque laudantium.”
Lorem Ipsum - Title and Company
The StoneX Group Inc. group of companies provides financial services worldwide through its subsidiaries, including physical commodities, securities, exchange-traded and over-the-counter derivatives, risk management, global payments and foreign exchange products in accordance with applicable law in the jurisdictions where services are provided. References to over-the-counter (“OTC”) products or swaps are made on behalf of StoneX Markets LLC (“SXM”), a member of the National Futures Association (“NFA”) and provisionally registered with the U.S. Commodity Futures Trading Commission (“CFTC”) as a swap dealer. SXM’s products are designed only for individuals or firms who qualify under CFTC rules as an ‘Eligible Contract Participant’ (“ECP”) and who have been accepted as customers of SXM. StoneX Financial Inc. (“SFI”) is a member of FINRA/NFA/SIPC and registered with the MSRB. SFI does business as Daniels Trading/Top Third/Futures Online. SFI is registered with the U.S. Securities and Exchange Commission (“SEC”) as a Broker-Dealer and with the CFTC as a Futures Commission Merchant and Commodity Trading Adviser. References to securities trading are made on behalf of the BD Division of SFI and are intended only for an audience of institutional clients as defined by FINRA Rule 4512(c). References to exchange-traded futures and options are made on behalf of the FCM Division of SFI.
Trading swaps and over-the-counter derivatives, exchange-traded derivatives and options and securities involves substantial risk and is not suitable for all investors. The information herein is not a recommendation to trade nor investment research or an offer to buy or sell any derivative or security. It does not take into account your particular investment objectives, financial situation or needs and does not create a binding obligation on any of the StoneX group of companies to enter into any transaction with you. You are advised to perform an independent investigation of any transaction to determine whether any transaction is suitable for you. No part of this material may be copied, photocopied or duplicated in any form by any means or redistributed without the prior written consent of StoneX Group Inc.
© 2025 StoneX Group Inc. All Rights Reserved.